Solution
Industrial Energy Monitoring System
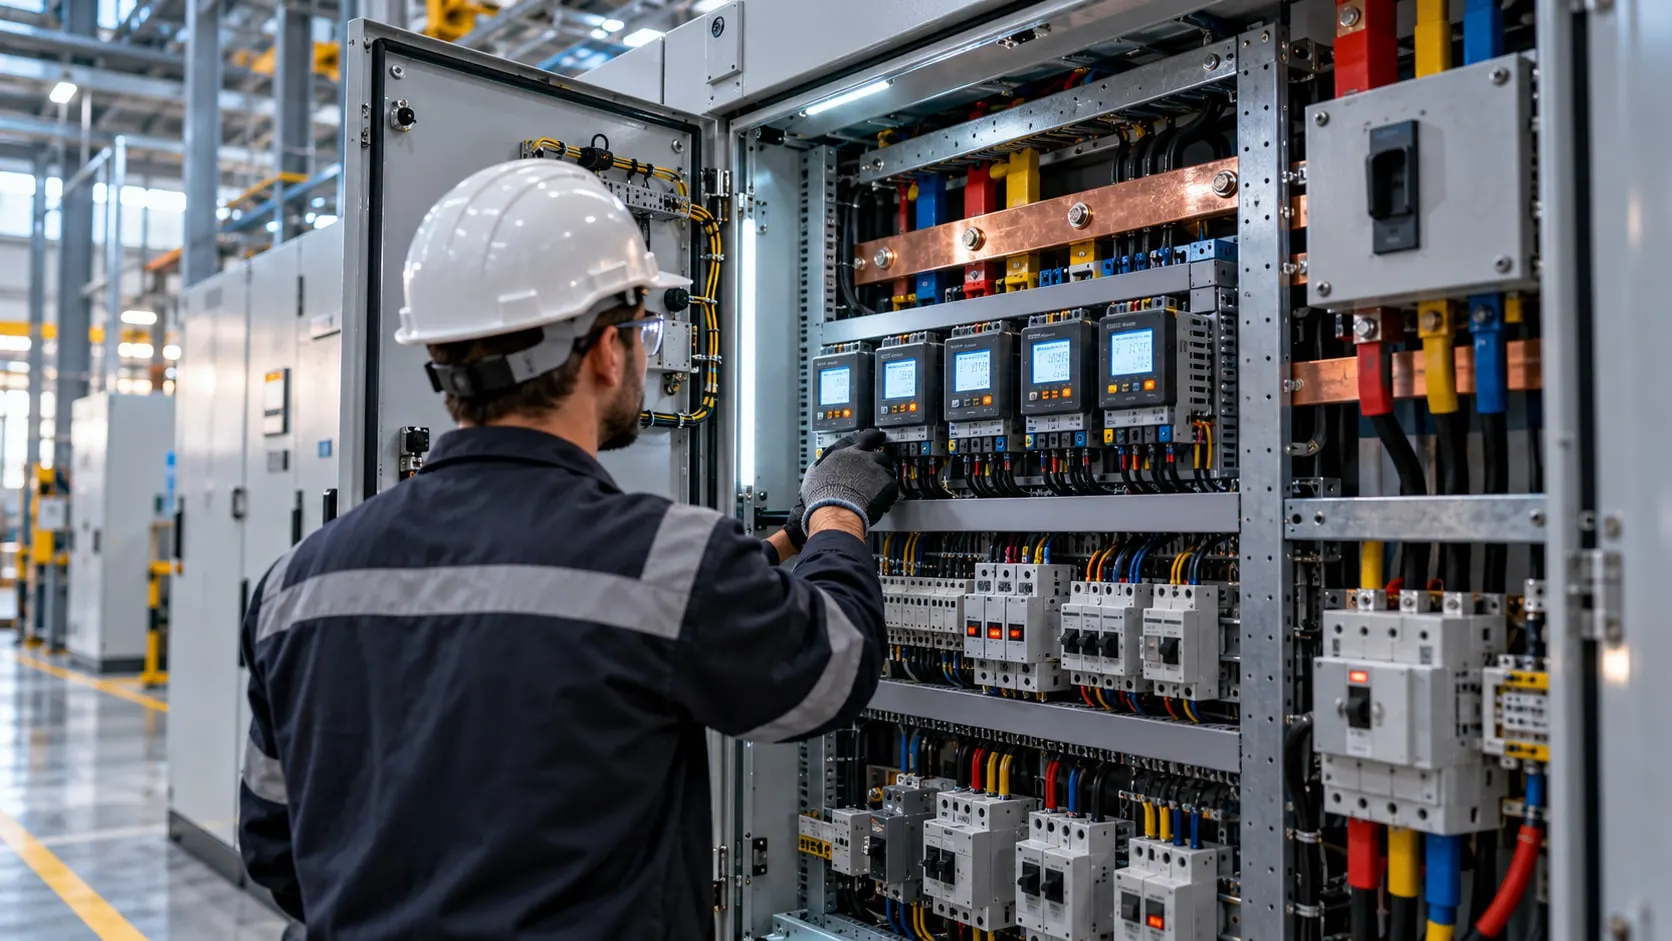
We build energy monitoring that measures electricity, gas, compressed air and water by machine and line, and ties consumption to what was produced.
Our clients
- Siemens

- Anadolu Isuzu

- BSH
- Tofaş

- Toyotetsu

- Martur

- Turkcell

- Vodafone

- Doğadan

- Pakmaya

- Bross

- Abdi İbrahim

- Nobel İlaç

- Plastimak

- Dalgıç Kalıp

- Barbaros Motor

- Magneti Marelli

- Rözmaş

- Sanel

An energy monitoring system collects consumption data from meters and power analyzers automatically and breaks it down by line, machine and product. The monthly bill tells you the total, not which line, shift or product used it. That is why idling compressors, ovens left on over the weekend and reactive power penalties are found late.
Energy data on its own has limited value; it becomes useful next to production data. Because VOLSOFT collects energy and production data on the same platform, energy per unit, consumption by machine state and idle losses are calculated directly.
At Anadolu Isuzu, data was collected from energy systems alongside production equipment. As in every project, energy monitoring runs on Proxus on the customer's own servers.
What we deliver
Energy Monitoring
-
Meter and analyzer integration
Existing power analyzers and meters are read over Modbus RTU/TCP or through the PLC. Where measurement points are missing, we plan them with standard products.
-
Beyond electricity
Natural gas, compressed air, steam and water are tracked in the same model. Weekend compressed-air consumption is reported as a leak indicator.
-
Energy tied to production
Consumption is joined with machine state, work order and output to calculate energy per unit and idle consumption.
-
Data for ISO 50001
Energy performance indicators (EnPIs) for significant energy uses and an energy baseline (EnB) normalized for production volume and weather are set up.
-
Power quality and demand
Power factor, reactive energy ratios and demand are monitored, with alerts before contractual limits are reached.
How a project runs
From discovery to live, step by step
- 01
Energy inventory
We map main and sub-distribution, large consumers and existing meters, and define the metering hierarchy.
- 02
Connectivity
Meters and analyzers are connected to Proxus, and units and multipliers, including CT ratios, are verified.
- 03
Model and indicators
Consumption is placed in the site, area and line hierarchy, joined with production data, and EnPIs and baselines are defined.
- 04
Reports and alerts
Dashboards for the energy manager and production, periodic reports suited to ISO 50001 reviews, and alerts go live.
Built on Proxus
Power analyzers mostly speak Modbus; Proxus reads them with its Modbus driver and stores the data in the same historian and dashboards as production data.
Proxus is the industrial data platform built by the VOLSOFT team.
Frequently asked questions
Common questions
What is an industrial energy monitoring system?
It is software that collects electricity, gas, compressed air and water consumption from meters and analyzers and shows it by site, line and machine. Combined with production data, it reveals energy per unit and where energy is wasted.
How do you install an energy monitoring system?
Start with an energy inventory and a metering hierarchy. Then connect existing analyzers and meters, add missing measurement points, link consumption to production and build reports. Scope depends on plant size and existing metering.
What data does ISO 50001 require?
ISO 50001 asks you to identify significant energy uses and define energy performance indicators and an energy baseline. That requires regular measurement of consumption alongside relevant variables such as production volume and outdoor temperature, which an energy monitoring system automates.
Can we use our existing power meters?
Usually yes. Meters and analyzers with Modbus RTU/TCP or another communication interface are read directly, and pulse outputs cover simpler meters. Where new metering is needed, we specify standard products; VOLSOFT does not resell devices.
Why connect energy data to production data?
Because total consumption hides the cause. Joined with machine state and output, energy data shows idle consumption, energy per unit by product and which line drives a change, which is what an energy manager can actually act on.
Related pages
Often looked at together
- ServiceMachine Data CollectionRead-only production data collection from PLCs, CNCs and robots, with control logic left untouched.Explore→
- ServiceDashboards and ReportingLine screens, shift and management reports, plus integration with existing SCADA and historians.Explore→
- ServiceDigital Transformation ConsultingSIRI maturity assessment, roadmap, architecture and technical preparation for funding programs.Explore→
- IndustryEnergy and utilitiesSCADA integration and meter reading for substations, industrial-zone grids and solar plants.Explore→
- TechnologyModbus integrationReading Modbus TCP devices, and Modbus RTU through a serial device server, from register maps.Explore→
- GuideWhat is LoRaWAN and how does it work? Gateways, sensors and industrial useWhat LoRaWAN is and how it works: gateways, network servers, device classes, sensor choices, LoRaWAN vs NB-IoT, Wi-Fi and 4G, and use in factories.Explore→

Next step
Let’s turn your goal into a clear engineering scope.
Tell us about your plant, your machines and your goal. An integration engineer will set up a discovery call with you.